How $1,000 plus regular contributions turned into $823,000 through compounding

.
Imagine planting a tree that not only grows fruit but also grows more branches, which grow even more fruit.
That’s compound interest in motion, which is sometimes referred to as the “eighth wonder of the world”. It’s the financial phenomenon where your money earns interest, and then that interest earns interest too.
The longer you leave your money invested, the more it can multiply, thanks to the snowball effect of reinvesting your earnings.
A simple strategy that pays long-term dividends
Whether you’re saving for retirement, a home, or just building wealth, compound interest is your quiet, powerful ally. Start early, stay consistent, and let time do the heavy lifting.
For example, assuming a 9.3% average annual return with all income distributions reinvested, an initial investment of $1,000 in the S&P/ASX All Ordinaries Total Return Index on 1 July 1995-implemented through a broad index-tracking fund-would have appreciated to $14,379 by 30 June 2025.*
That’s not bad. A sizeable 1,340% return, in fact, by doing nothing other than reinvesting all income distributions back into the same investment to harness the power of compounding.
But an investor could have achieved returns many multiples higher by adding regular amounts of “financial fertiliser” to their money tree over the same time period.
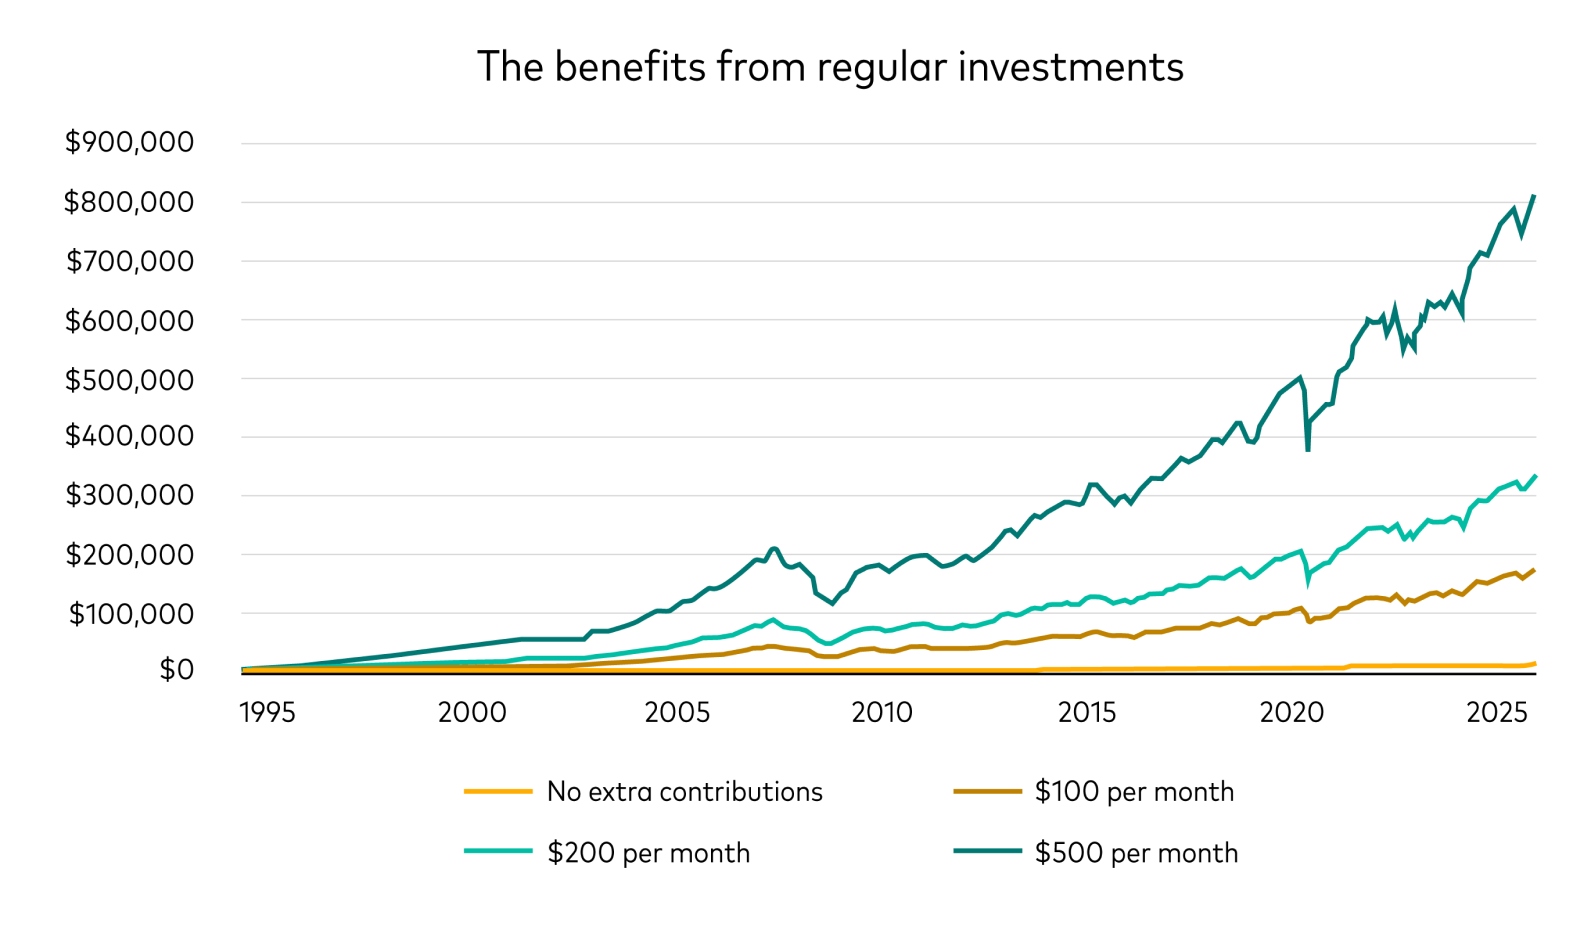
It’s how a $1,000 initial investment could have grown to over $823,000 by 30 June 2025.
Adding $100 per month
Just by adding $100 per month, an initial investment of $1,000 on 1 July 1995 would have compounded to more than $176,000 by 30 June 2025. That’s based on the performance of the S&P/ASX All Ordinaries Total Return Index, the addition of regular investments, and the reinvestment of all distributions.
Put another way, by making a total of $36,000 in additional investments over 30 years, a $1,000 initial investment combined with compounding growth would have returned close to $162,000 more than the $14,379 balance from making no additional investments.
The returns numbers assume no investment management fees, indirect trading costs, or capital gains taxes were incurred along the way.
Adding $200 per month
By adding $200 per month, an initial $1,000 investment, once again based on the performance of the S&P/ASX All Ordinaries Total Return Index, would have grown to around $338,000.
That’s a $73,000 total investment (the initial $1,000 plus $72,000 in additional investments) over 30 years to achieve an investment worth around $323,000 more than the $14,379 balance if no additional investments had been made.
Adding $500 per month
However, a regular investments strategy of $500 per month over 30 years ($180,000 in total) would have seen the initial $1,000 investment grow to $823,114 by 30 June 2025 – more than $808,000 higher than the $14,379 balance if no additional investments had been made.
Here’s how the investment balance numbers would have looked at different points in time, based on the actual performance of the S&P/ASX All Ordinaries Total Return Index, from 1 July 1995 to 30 June 2025.
Source: Vanguard. Returns based on S&P/ASX All Ordinaries Total Return Index. Assumes the reinvestment of income distributions and does not take into consideration investment management fees, indirect costs, buy/sell spreads, or taxes.
Past performance information is given for illustrative purposes only and should not be relied upon as, and is not, an indication of future performance. The performance of an index is not an exact representation of any particular investment as you cannot invest directly in an index.
It’s only when you compare the numbers in the table side by side that the full picture becomes much clearer.
An initial contribution amount combined with a regular investment savings strategy and the reinvestment of income distributions over time can deliver much higher long-term compound returns.
How regular contributions stacked up
| Date | $0 contributions | $100 per month | $200 per month | $500 per month |
|---|---|---|---|---|
| 1 July 1995 | $1,000 | $1,000 | $1,000 | $1,000 |
| 30 June 2000 | $1,951 | $10,409 | $18,867 | $44,240 |
| 30 June 2005 | $3,062 | $24,823 | $46,583 | $111,864 |
| 30 June 2010 | $3,857 | $37,164 | $70,471 | $170,391 |
| 30 June 2015 | $6,034 | $65,633 | $125,232 | $304,030 |
| 30 June 2020 | $8,159 | $95,545 | $182,930 | $445,087 |
| 30 June 2025 | $14,379 | $176,126 | $337,873 | $823,114 |
Source: Vanguard. Returns based on S&P/ASX All Ordinaries Total Return Index. Assumes the reinvestment of income distributions and does not take into consideration investment management fees, indirect costs, buy/sell spreads, or taxes. Values have been rounded down the nearest dollar.
Past performance information is given for illustrative purposes only and should not be relied upon as, and is not, an indication of future performance. The performance of an index is not an exact representation of any particular investment as you cannot invest directly in an index.
In the examples used above, there would have already been a significant returns gap after just five years (by 2000) between investors who had not made regular investments versus others that had.
That gap would have kept widening over time. After 10 years investors who had followed a $100 per month regular investments strategy would have had a balance more than eight times greater than someone who had not made additional investments but had just reinvested their income distributions. By 2025 the balance differential would have widened to over 12 times.
On regular investments of $200 per month, the balance gap would have been more than 23 times by 2025, and based on regular investments of $500 per month it would have been close to 60 times.
Of course, the returns numbers would have been significantly higher based on a higher initial investment amount.
A $10,000 initial investment in July 1995 combined with $500 per month additional investments would have compounded to more than $950,000 by 30 June 2025.
Staying the course
The 30-year period between mid-1995 and mid-2025 has included nine Australian prime ministers and six U.S. presidents.
It has also included the Asian currency crisis in 1997, the dot.com crash in 2000, the Global Financial Crisis from 2007 into 2009, and the COVID-19 market crash in 2020.
To harness the full benefits of compounding over time, it’s important to have a disciplined, non-emotional approach to investing, irrespective of short-term events and volatility.
Making regular investments, and taking advantage of compounding returns, can really add up over the longer term.
They’re a powerful combination in helping you to focus on achieving your investment goals, ideally through an appropriately diversified portfolio, to give you the best chance of investment success.
Any investment is subject to investment and other known and unknown risks, including possible delays in repayment and loss of income and principal invested.
* The examples of an investment of $1,000 into S&P/ASX All Ordinaries Total Return Index on 1 July 1995 and the corresponding outcomes as of 30 June 2025 expressed in this article are based on the past performance of the S&P/ASX All Ordinaries Total Return Index. They assume the $1,000 is fully invested (and remains fully invested). The calculations assume no acquisition costs, fees or taxes, with all distributions reinvested. All results are displayed in nominal dollars i.e. inflation has not been taken into account. An actual investment would be subject to acquisition costs, fees and taxes.
Important Information
Vanguard Investments Australia Ltd (ABN 72 072 881 086 / AFS Licence 227263) (VIA) is the product issuer and operator of Vanguard Personal Investor and Vanguard ETFs and managed funds. Vanguard Super Pty Ltd (ABN 73 643 614 386 / AFS Licence 526270) (the Trustee) is the trustee and product issuer of Vanguard Super (ABN 27 923 449 966).
The Trustee has contracted with VIA to provide some services for Vanguard Super. Any general advice is provided by VIA. The Trustee and VIA are both wholly owned subsidiaries of The Vanguard Group, Inc (collectively, “Vanguard”).
We have not taken your objectives, financial situation or needs into account when preparing this article so it may not be applicable to the particular situation you are considering. You should consider your objectives, financial situation or needs, and the disclosure documents for the product before making any investment decision. Before you make any financial decision regarding the product, you should seek professional advice from a suitably qualified adviser. A copy of the Target Market Determinations (TMD) for Vanguard's financial products can be obtained on our website free of charge, which includes a description of who the financial product is appropriate for. You should refer to the TMD of the product before making any investment decisions. You can access our Investor Directed Portfolio Service (IDPS) Guide, Product Disclosure Statements (PDS), Prospectus and TMD at vanguard.com.au and Vanguard Super SaveSmart and TMD at vanguard.com.au/super or by calling 1300 655 101. Past performance information is given for illustrative purposes only and should not be relied upon as, and is not, an indication of future performance.
This article was prepared in good faith and we accept no liability for any errors or omissions.
Vanguard
18 August 2025
vanguard.com.au